
Case study
Enerxus
Real-time energy data portal aggregating prices, demand, renewable mix and emissions across Spain and Europe in a single dashboard.
Context
Electricity-market information lives scattered across REE, ESIOS, ENTSO-E, OMIE, Eurostat, MIBGAS, AEMET and half a dozen other official sources. Each with its own API, format and logic. For anyone interested in the market, comparing prices or understanding today's energy mix means opening five tabs and translating in their head.
What I built
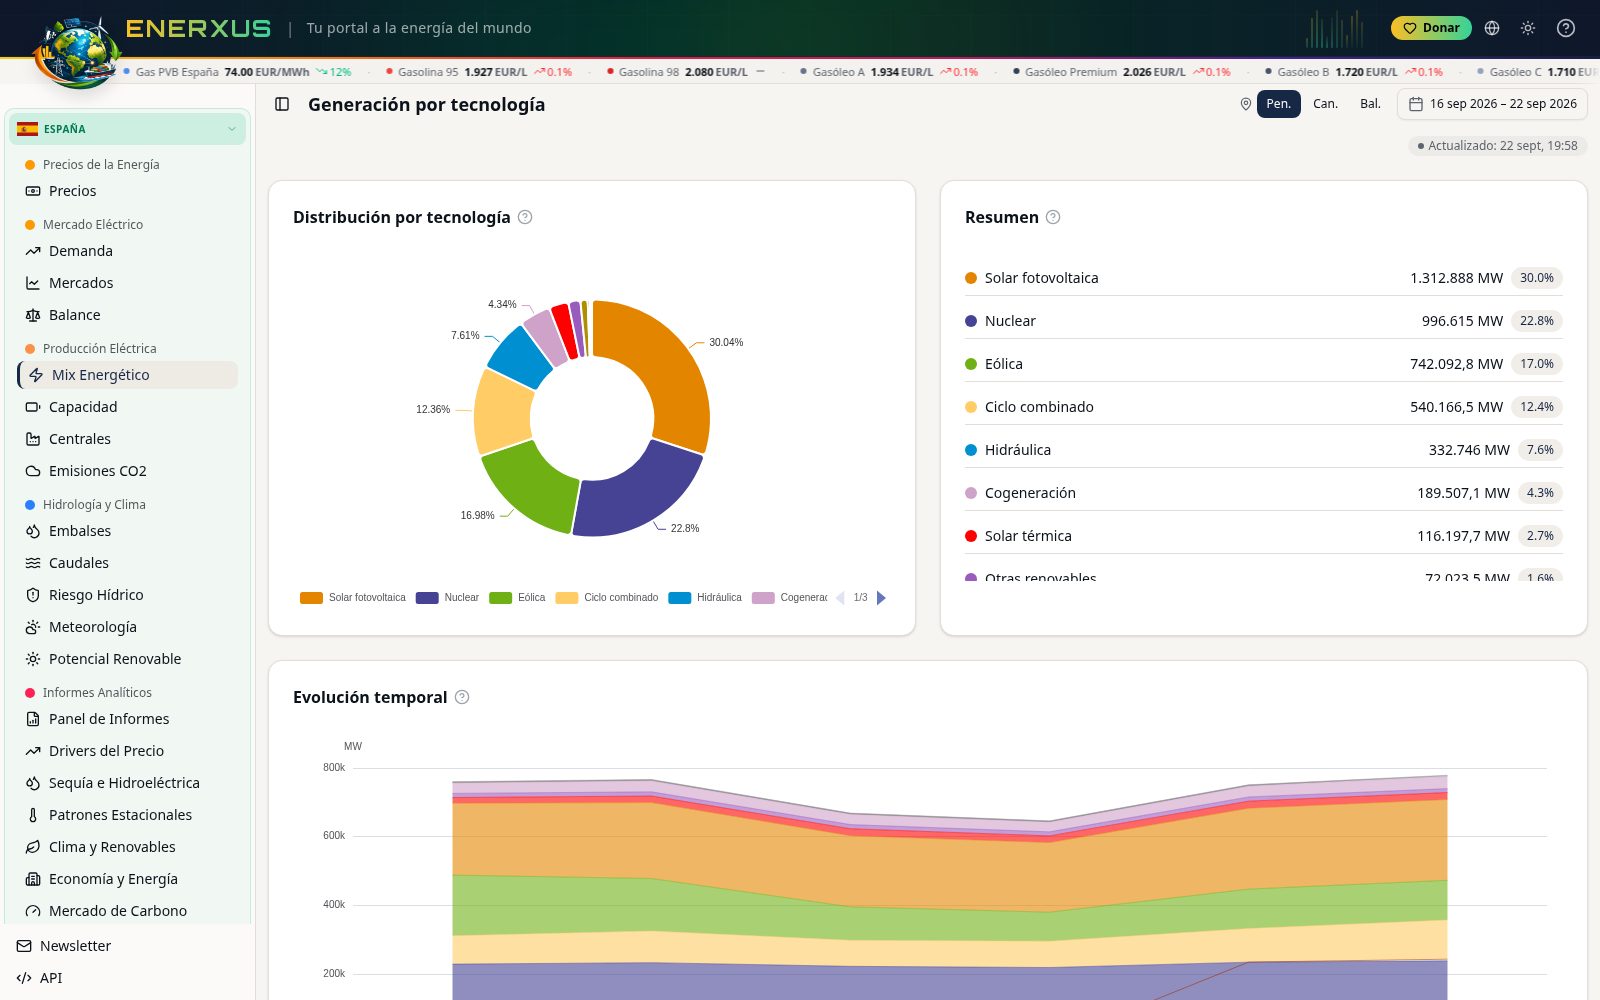
Enerxus consolidates all those sources into a single portal with real-time interactive dashboards: electricity and fuel prices, peninsular demand, generation mix, installed capacity, plant map, CO₂ emissions, reservoir levels and flows, weather data, and European comparisons. Bilingual (ES/EN), installable as a PWA, with a sector news aggregator on top.
Technical details
- Next.js 16 frontend with App Router, Tailwind and a bespoke component library.
- Prisma over PostgreSQL backend, with scheduled jobs syncing external APIs and normalizing the data.
- Aggressive caching so dashboards respond in <200 ms even when the upstream source is slow.
- Stripe wired up for subscription tiers (Starter / Pro) when monetization rolls out.
- Companion mobile app in React Native (Android/iOS) consuming the same API.
Status
Live at enerxus.eu. Freemium model with subscription tiers already configured in Stripe. Iterating on discoverability and technical SEO while the product keeps gaining domain depth.